
Heatmaps
See the why behind the numbers, in color.
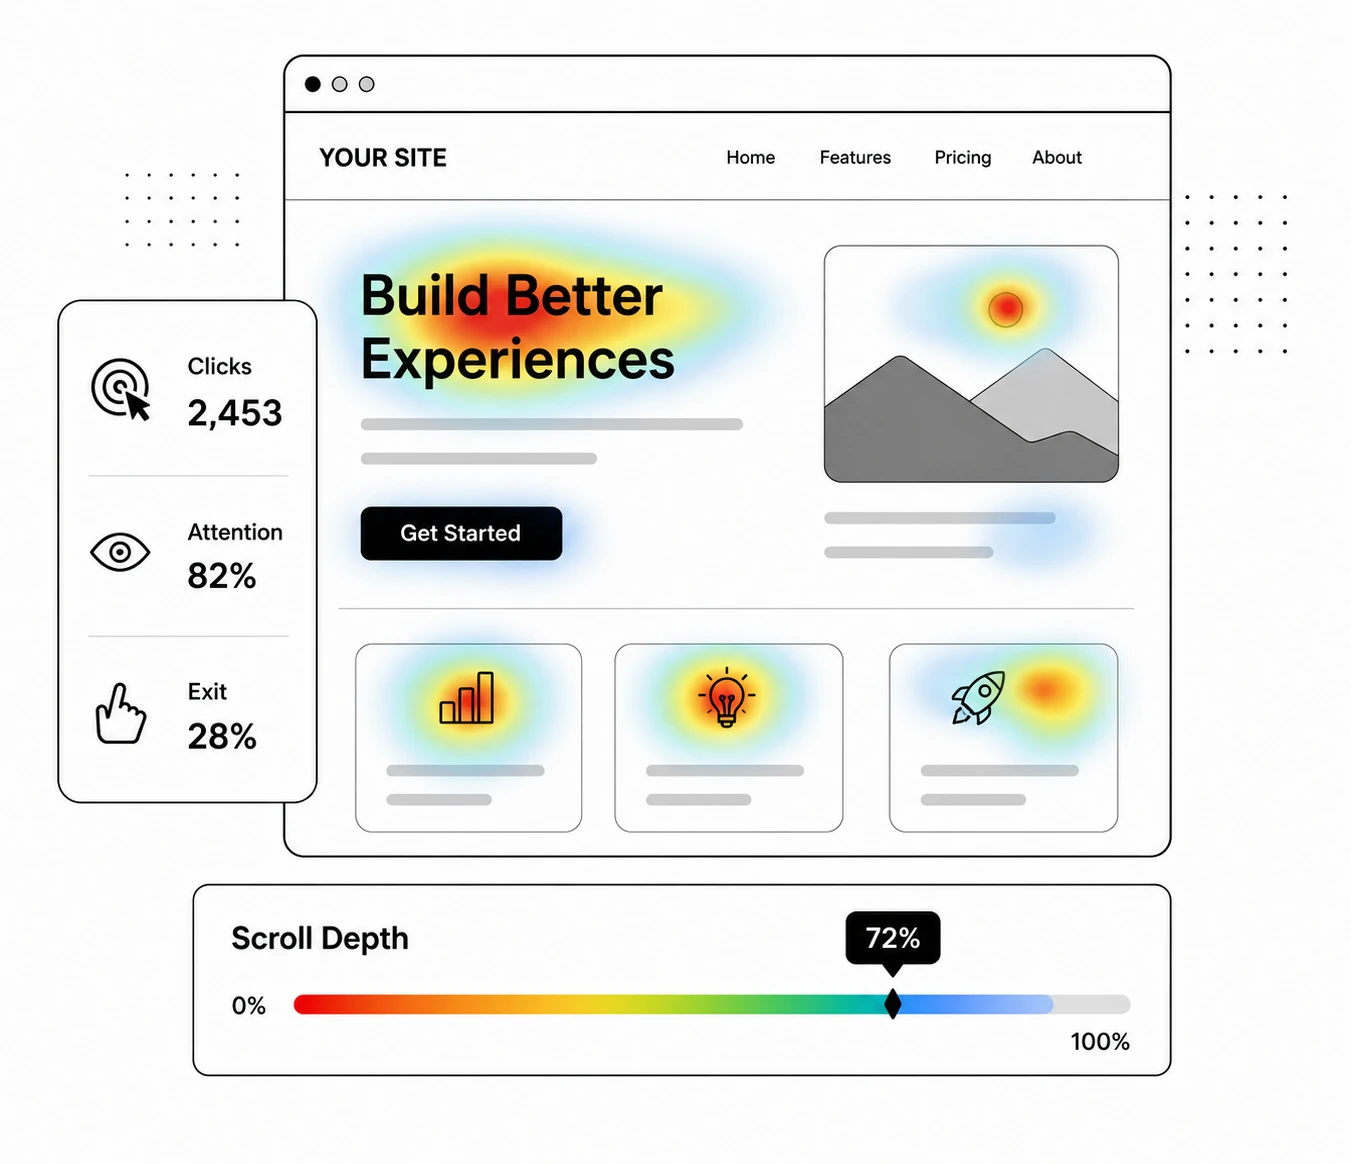
Clicks, reading, exits. From site-wide trends to single-page behavior, five views visualize user actions and surface clues for CVR improvement.
Start with site-wide movement on one screen.
Review PV, visitors, CV, CVR, and tracked URL count on a dashboard
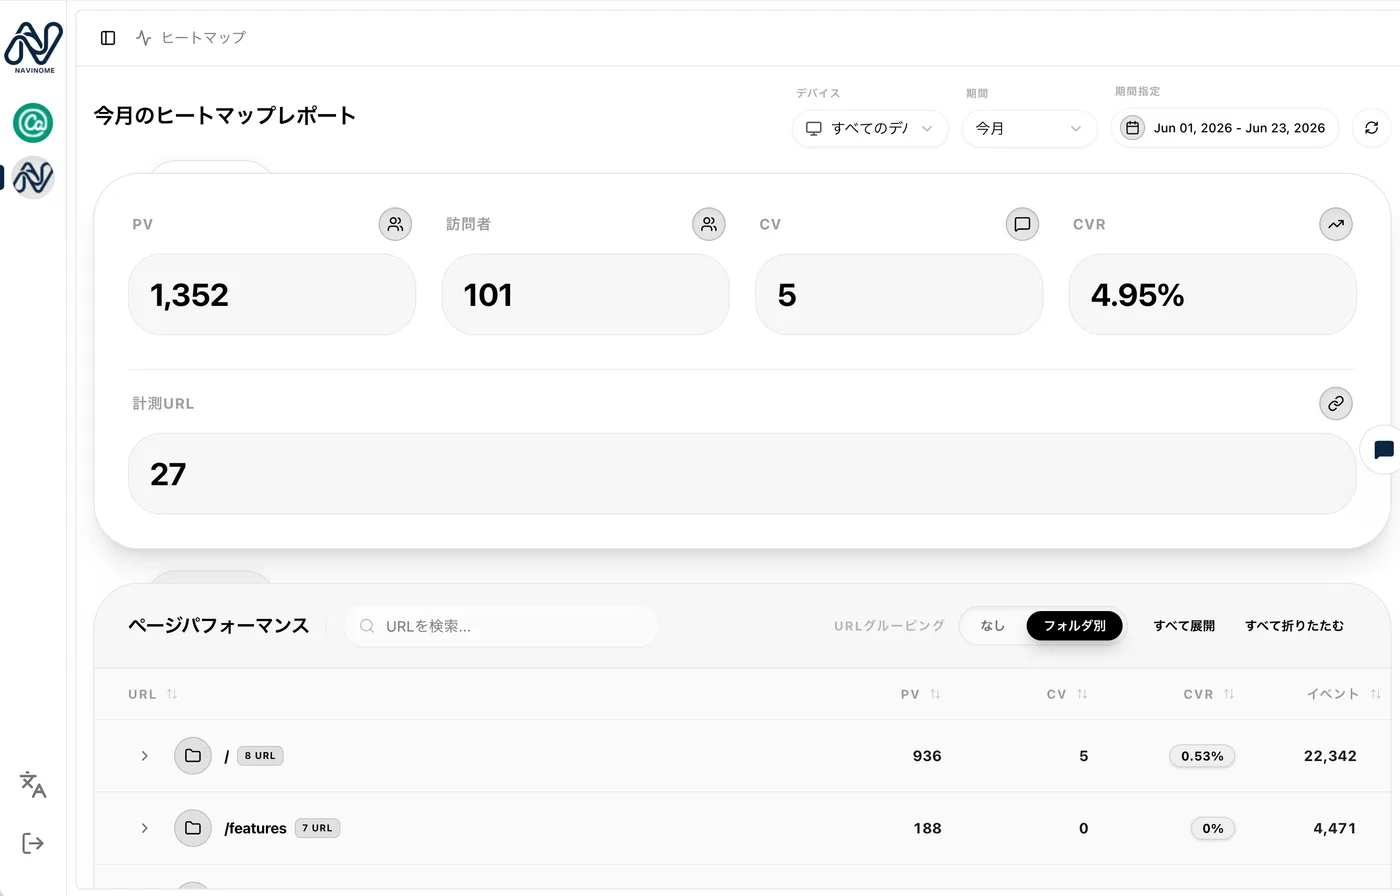
Tracked URLs are listed automatically. Use URL groups to filter and focus on specific page sets.
Five views to read user behavior.
Switch tabs to see the same page from different angles
Click
Shows where users click most often
Click event
Tracks clicks on elements you specify
Reading
Shows areas users read closely
Dwell
Shows sections where users spend time
Exit
Shows where users leave the page
See what happens at each scroll depth.
The page is split in 5% increments so you can track behavior changes numerically
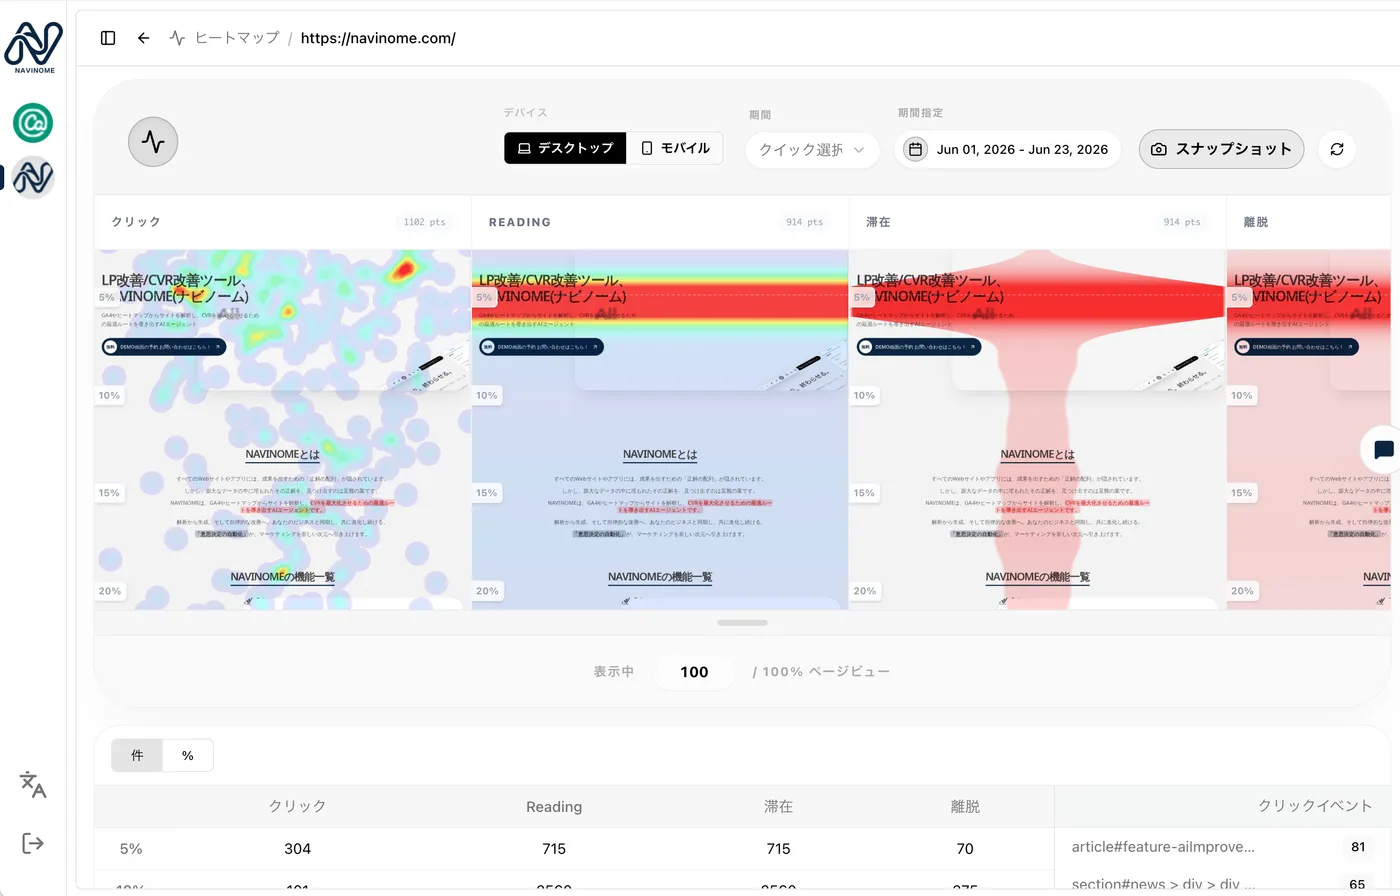
Clicked elements are identified down to the HTML name and count, such as "button#add-to-cart-btn". Switch device and date range on the spot.
View, switch, compare, then act.
Select a page
Pick the page you want to review from the URL list.
Switch heatmap type
Use the tabs to switch between click, reading, dwell, exit, and other views.
Compare patterns
Switch between the original and A/B test variants to compare behavior.
Turn insights into the next hypothesis
Use what you see to shape the next A/B test hypothesis.
Cold zones and hot zones
Cold zone
A key CTA with weak engagement. A signal to revisit design or messaging.
Hot zone
Unexpected engagement. A sign of user interest worth exploring.
Hypothesize moving CTAs from cold zones to hot zones, then validate with A/B tests. That is the basic loop between heatmaps and A/B testing.
Related articles
Learn more about heatmaps and behavioral analytics



Frequently asked questions
Can I view heatmaps for each A/B test pattern?
Yes. Switch between the original and variants to review behavior data for each pattern separately.
Which heatmap type should I start with?
Start with the click heatmap to check reactions to key CTAs. If exits are a concern, combine it with the exit heatmap to spot causes more easily.
Do I need surveys to use heatmaps?
No. Heatmaps are built from actual user behavior, so you do not need separate surveys.
Can I review the whole site at once?
Yes. The site-wide report shows PV, visitors, CV, CVR, and tracked URLs on one screen. URL groups let you focus on specific page sets.
Can I identify which elements were clicked?
Yes. You can see the HTML element name and click count, such as "button#add-to-cart-btn", so you know exactly which buttons or images get engagement.
Ready to see the why behind user behavior?
Book a free demo to explore real heatmaps.