
AI Analysis Feature
Enter a URL to decode your site's "genome."
Integrate GA4, heatmaps, and past optimization cases. AI shows where CVR improvement should start.
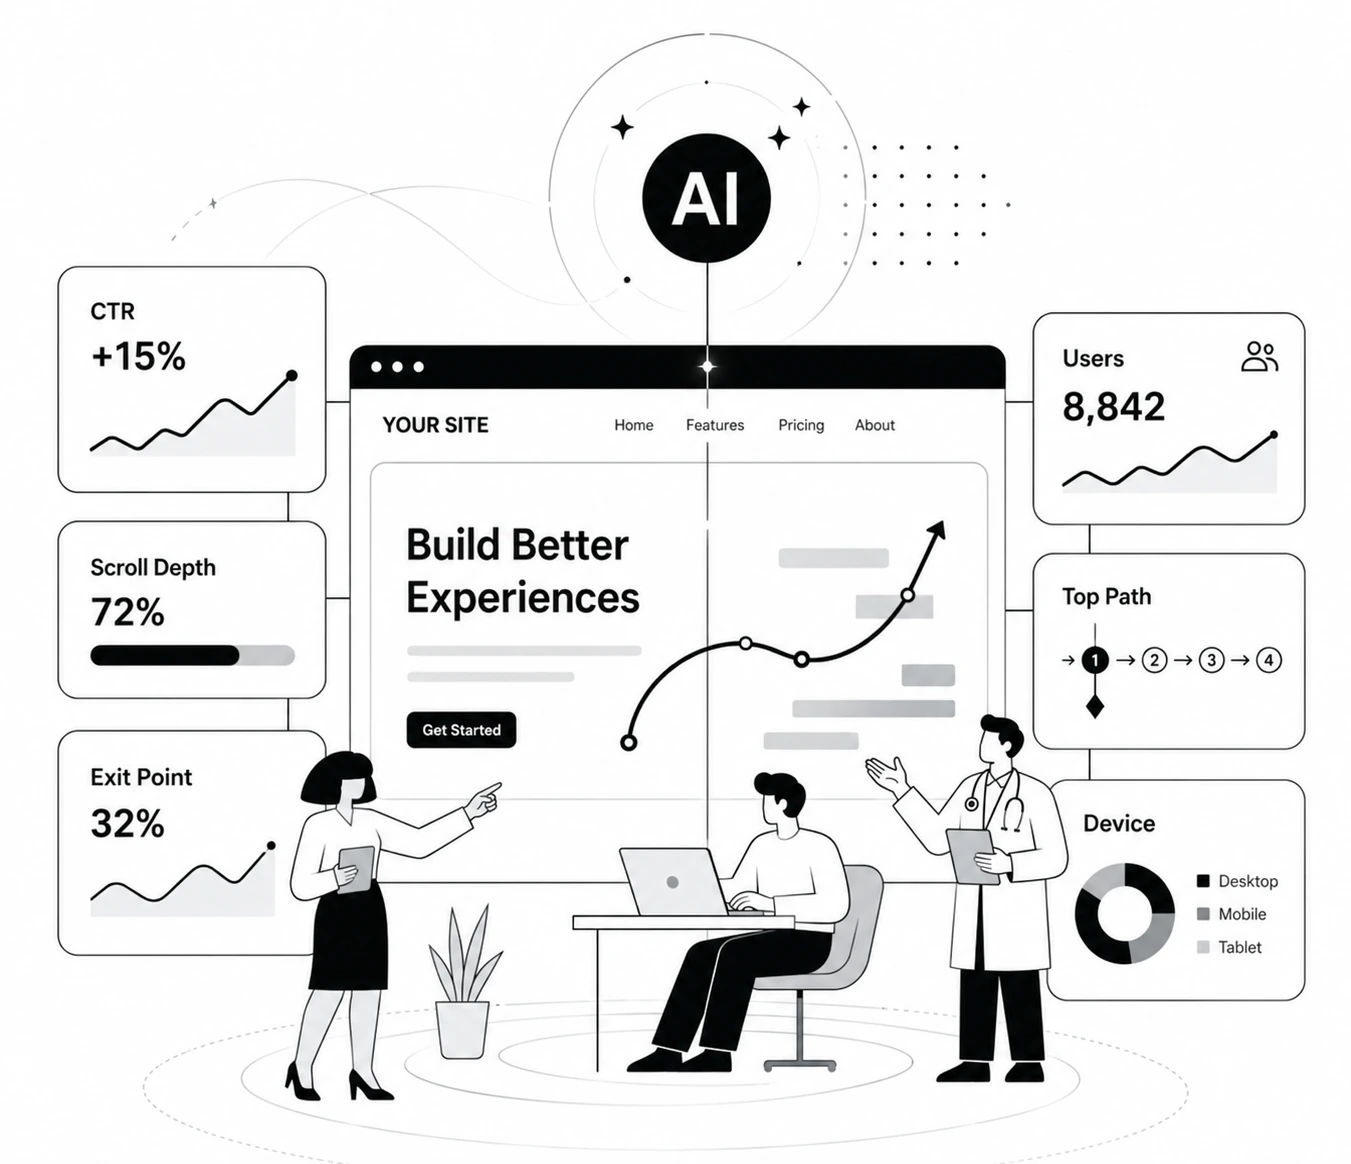
Three data sources, one analysis.
Data you used to view in separate tools, read together by AI
GA4 data
Analyze traffic sources, page paths, and conversion trends.
Heatmaps
Visualize click, engagement, and exit patterns at the page level.
Optimization cases
Compare against past improvement patterns to sharpen hypotheses.
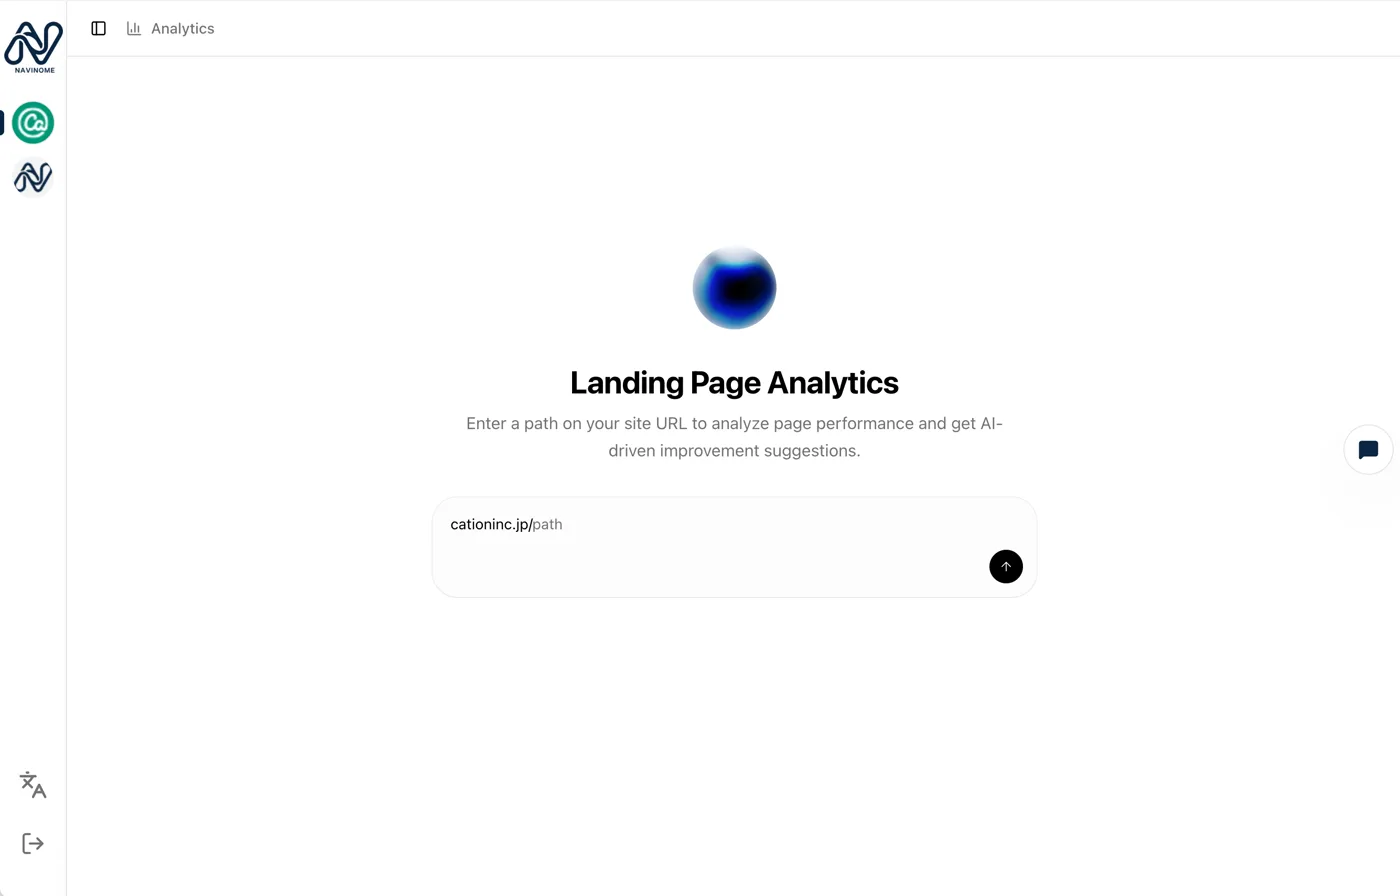
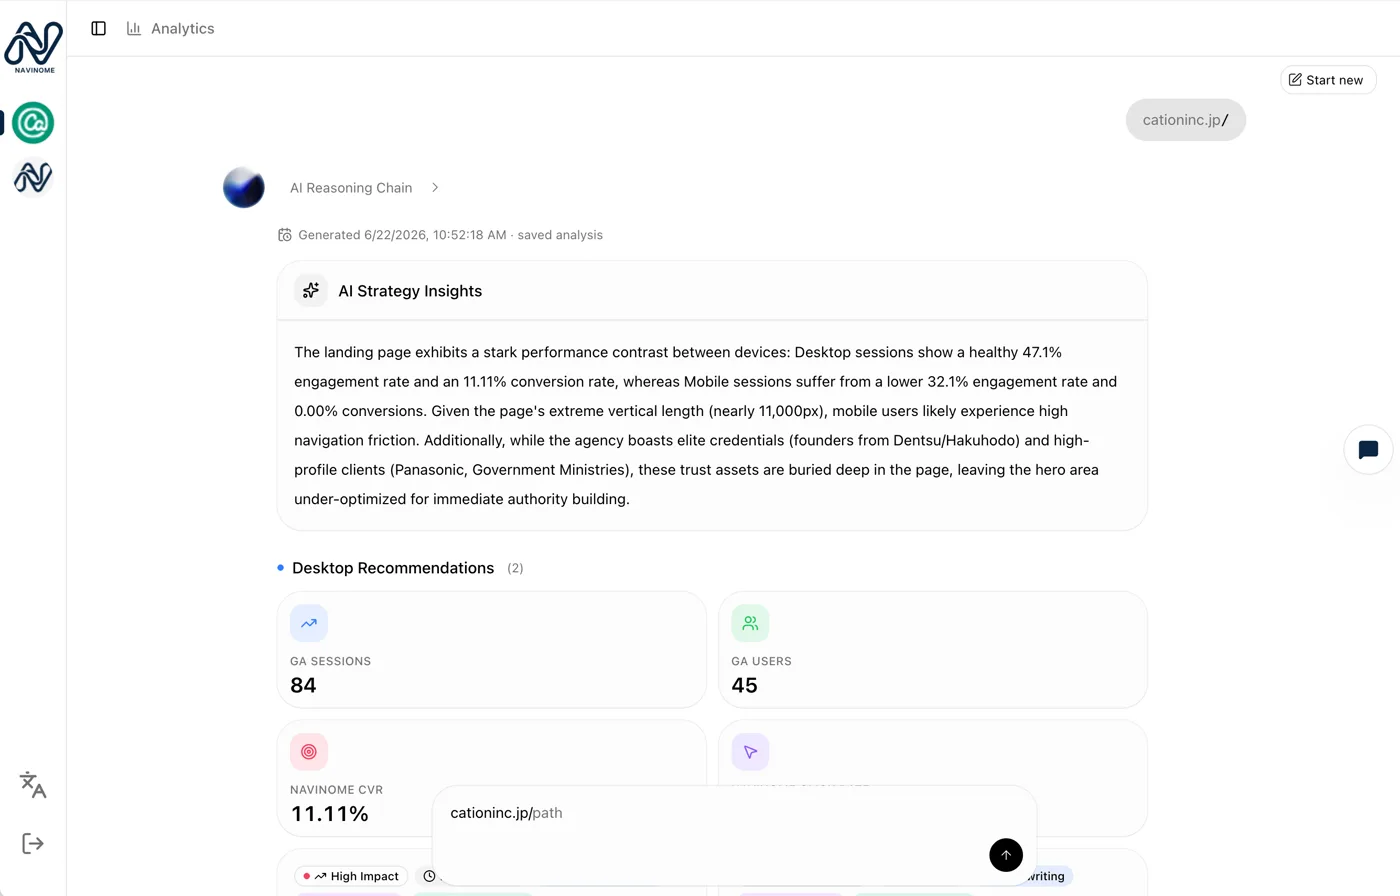
When analysis finishes, the numbers appear first.
Review GA sessions, users, CVR, and click rate on one screen
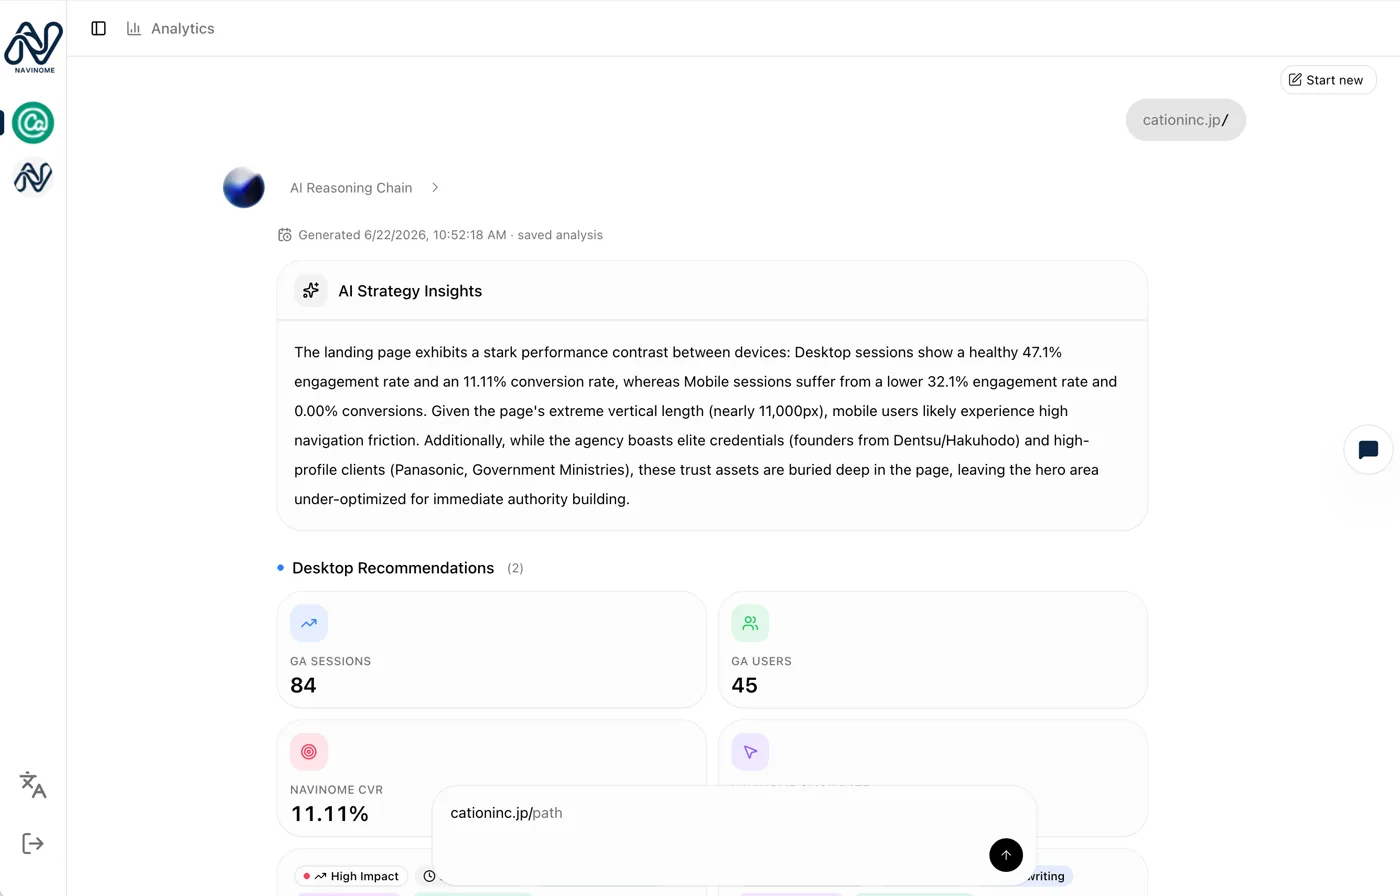
This metrics summary appears within seconds after you enter a URL. Start by understanding the page's current state in numbers, then read the AI strategic insight that follows to explain why.
What analysis reveals
AI puts the "why" behind the numbers into words
AI strategic insight
Beyond listing engagement rate and CVR, AI explains why results look the way they do. It cross-checks page messaging with behavioral data and surfaces easy-to-miss factors in plain language.
"Clarity of the value proposition in the first view and insufficient CTA exposure for users scrolling through the page are the main drivers of drop-off."
Device-level trends
Desktop and mobile are analyzed separately. Session and CVR differences reveal device-specific issues.
Prioritized suggestions
Each suggestion shows priority (high/medium), effort, and category (UX improvement, value proposition, friction reduction, and more) so you can see where to start.
Analysis results flow straight into your next move.
AI analysis
One URL to start
Create plan
To plan board
A/B testing
Review and apply
Related articles
Learn more about AI analysis and CVR improvement


Frequently asked questions
How much data is needed for analysis?
You can start once GA4 is connected. For low-traffic sites, we recommend collecting a few weeks of data until trends are clear.
Can I use my existing GA4 setup?
Yes. Connect your existing GA4 property. There is no need to add lots of new measurement tags.
Are desktop and mobile analyzed separately?
Yes. Behavior differs by device, so improvement suggestions are provided for desktop and mobile separately.
How should I use the analysis results?
Select suggestions you want to pursue and click "Create plan" to add them to your plan board. From there, prioritize and move into A/B testing.
Why not start by analyzing your site?
Book a free demo to see actual analysis results.